Build the audience that keeps coming back
Parse.ly tells the whole team how content is performing right now, and how to make it even better.
Assisted by AI. Integrated in the editor.
Trusted by over 1,300 enterprises
Parse.ly by WordPress VIP is a content intelligence and analytics platform designed specifically for publishers, marketers, and content teams. It combines live dashboards, AI-powered optimization, and conversion intelligence inside the editorial workflow so your team can make real-time content decisions without waiting on analysts or data requests.
581
%
more data usage vs. Google
Analytics (Parse.ly survey)
Sub-second
data processing from event to dashboard
110
%
subscription growth at Slate by increasing reader loyalty and engagement
83
%
editor analytics adoption
at NAPCO Media, up from
20% on Google Analytics
Own your audience with analytics everyone checks
Parse.ly tracks the full reader journey, measures what matters, and puts the answers where your
whole team already works.
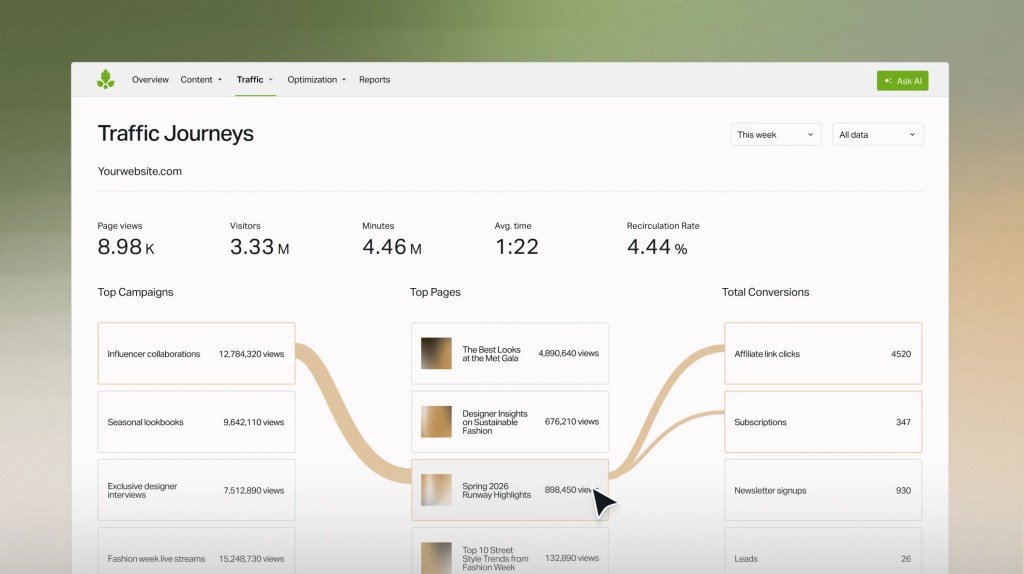
Borrowed traffic built your reach. Owned readers build your revenue.
Durable enterprises convert casual readers into subscribers. Parse.ly maps the journey from first touch to conversion, so you can make more of what moves them.
Define custom conversion goals and funnels tied to your business model
Segment your audience by behavior like free readers, registered users, and paying subscribers
Track newsletter-to-site traffic, subscriber engagement, and reader lifetime value
Measure campaign ROI with UTM analysis and custom grouping
Visualize the end-to-end reader journey with interactive Sankey diagrams
Content data that stays yours, no matter where it goes
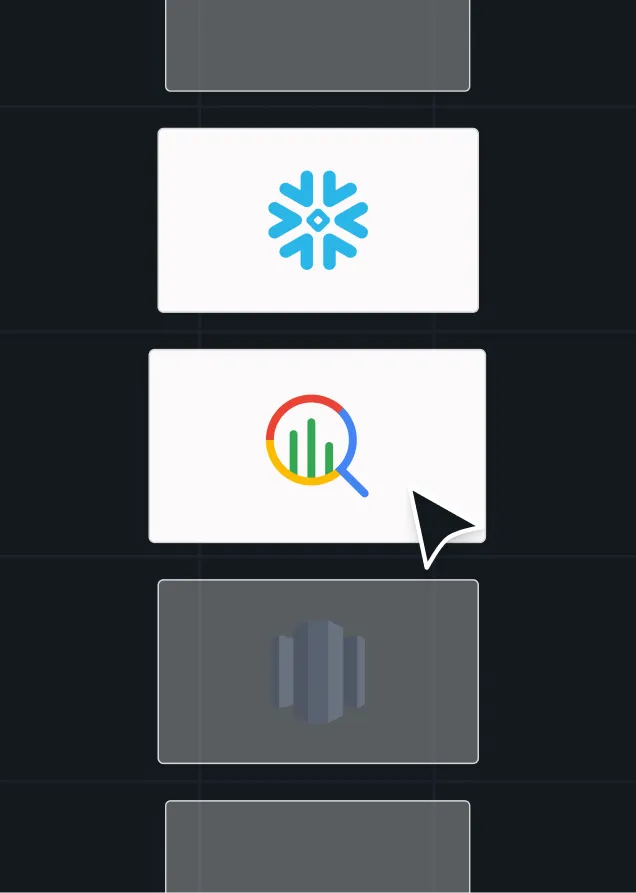
Most analytics tools end at the dashboard. Parse.ly starts there. Parse.ly’s data pipeline streams 100% unsampled event-level data to your data warehouse as it happens, seconds from event to availability. The data is fully yours, fully portable.
Combine content performance with subscriber data, CRM records, or ad revenue
Connect to BigQuery, Snowflake, Redshift, and custom warehouses
Build custom attribution models and downstream integrations with full API access
Analytics the entire team will actually use
Most analytics tools were built for data analysts. Parse.ly was built for editors, writers, and audience teams who need answers fast. No SQL queries, no training sessions, and no waiting on IT. Your team checks Parse.ly the way they check Slack, because it’s that intuitive and that essential.
Use a publisher-native interface built specifically for editorial teams
Deploy with a single JavaScript snippet and go live in minutes
Customize dashboards so each team member sees exactly the metrics they need
Access CMS-embedded insights directly in the WordPress editor
Share filtered dashboard views for collaborative analysis across teams
Measure what matters, beyond the pageview
Pageviews tell you something happened. Parse.ly tells you what actually indicates value.
Measure how long readers actively interact across all content, not just load
Track loyalty KPIs like recirculation rates, visit frequency, and reader return trends
Understand which Google keywords drive traffic to specific stories in the dashboard
Customize dashboards and reports per team, without depending on SQL, a BI team, or a separate export
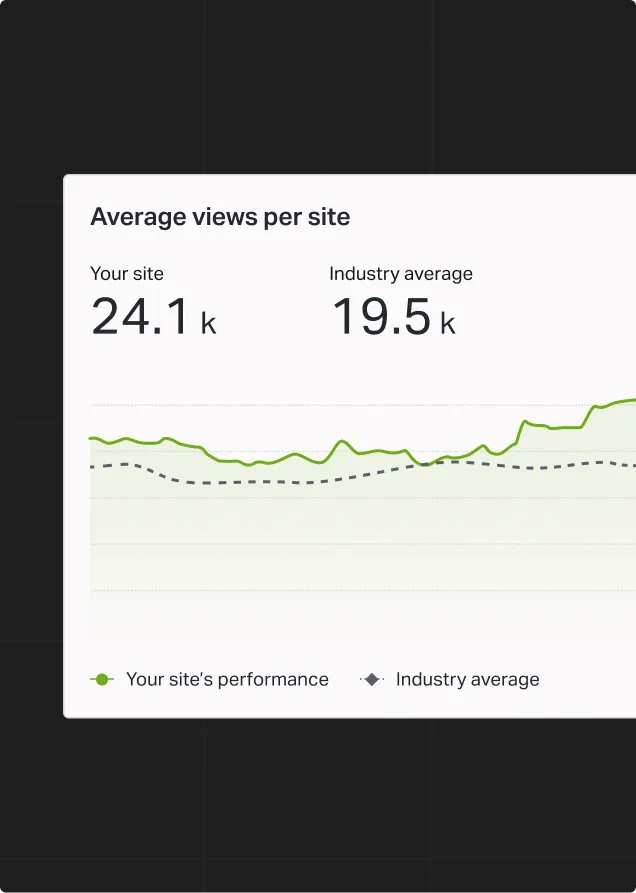
Benchmark your performance against aggregated publisher data
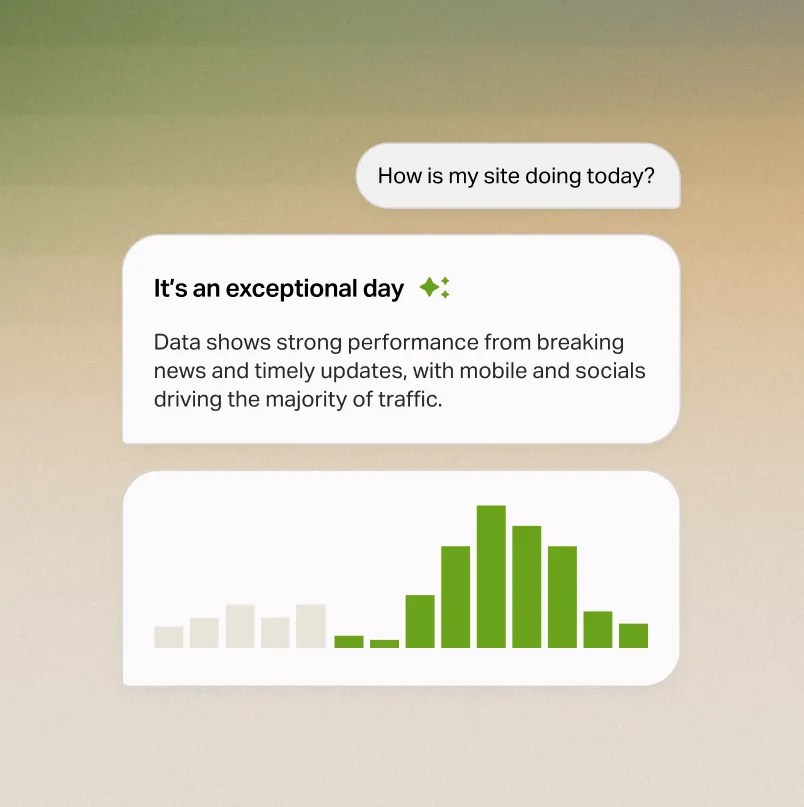
Most analytics are a postmortem. These are a pulse.
By the time most platforms tell you what worked, the moment has passed. Parse.ly shows you what’s happening while you can still do something about it, like testing and tweaking a headline in real time. Analytics often live behind a different login. Parse.ly Content Intelligence lives inside the editor, so past performance informs every new piece as you write it.
Monitor live content performance, updated every second across your site
Track traffic sources and content types, AI referrals included
Run live headline tests with AI variants and statistical significance scoring
Pull up performance for related past content from inside the editor
Get title and linking suggestions from real engagement data
Parse.ly Sage editorial intelligence
Questions that used to take an analyst now take a sentence
Dashboards work when you know what you’re looking for. Most editorial questions aren’t that clearcut. “What content drove the most subscriptions last quarter? Which topics are trending with returning readers?” Those aren’t dashboard clicks; those are analyst requests that take days.
Parse.ly Sage answers complex analytics questions in plain language, and smart tags categorize your content automatically with AI-generated topic and entity labels, so every query gets sharper over time.
Parse.ly MCP plugs your analytics into any AI client, so you can bring your audience data into your own workflows and integrate it with other first-party data.
Insight → decision → outcome.
In that order.

NAPCO Media
Saw editor analytics usage jump from 20% on Google Analytics to 83% on Parse.ly.

“Parse.ly allows us to get immediate feedback regarding what resonates with our audiences, and what doesn’t. This is something our editors really care about, and finally they have a way to access that information.”
David Leskusky
President, NAPCO Media

Slate
Used engaged time to increase reader loyalty and grow subscriptions by 110%.
110%
growth in paid subscriptions year
over year

Backstage
Saved 10% on ad spend by using Parse.ly’s conversions to drive growth.
20%
more conversions and 25% higher content marketing revenue


Network N
Increased ad revenue 75% after a site redesign informed by Parse.ly Insights.
75%
more revenue from content optimization


Wyndly
Grew organic search traffic by 5,300% through a new search strategy via Parse.ly.
5.3K%
more organic search traffic in first year

Frequently asked questions
Can I use Parse.ly alongside Google Analytics?
Yes. Parse.ly is designed to complement GA4, not replace it. GA4 handles marketing attribution and cross-channel measurement. Parse.ly provides real-time editorial intelligence, content-specific metrics like engaged time and recirculation, and publisher-native workflows that GA4 wasn’t designed to deliver.
What data does Parse.ly track about AI-referred traffic?
Parse.ly’s real-time referrer tracking separates AI-referred traffic from search, social, and aggregator traffic. You can see dedicated reports showing performance by content type and referrer source so you understand how AI discovery channels perform compared to traditional referral paths.
Does Parse.ly use AI to write content, or just to analyze it?
Parse.ly AI is focused on intelligence and optimization, not content generation. Headline Testing uses AI to suggest high-performing headline variants and automatically select winners. Parse.ly Sage answers complex analytics questions in natural language. Content Intelligence surfaces patterns and recommendations. Smart tags categorize content automatically. These tools make your editorial team faster and better informed. They don’t replace editorial judgment.
How does Parse.ly attribution work, and does it require third-party cookies?
Parse.ly uses first-party data collection, not third-party cookies. Journeys maps reader paths from acquisition through content to conversion using customizable conversion groups and attribution. Define conversion events specific to your business model (subscriptions, newsletter signups, registrations) and track which content drives them. All attribution data is available in the dashboard and via the raw data pipeline.
Can Parse.ly integrate with our data warehouse?
Yes. Parse.ly’s data is compatible with BigQuery, Snowflake, Redshift, or any data warehouse your BI team uses. Full API access is also available for custom integrations and downstream systems.
Is Parse.ly included with WordPress VIP, or is it a separate product?
Parse.ly is available as part of WordPress VIP. Content Intelligence features are embedded directly in the WordPress editor for VIP customers. For specifics on your plan and what’s included, talk to our team.
How does Parse.ly compare to other analytics platforms like Chartbeat and Marfeel?
Parse.ly, Chartbeat, and Marfeel all serve publisher analytics. Parse.ly differentiates through deeper conversion journey tracking (Journeys), real-time intelligence, a raw data pipeline for custom analysis, native WordPress integration with in-editor intelligence, and a broader AI suite (Parse.ly Sage, MCP, Headline Testing, Content Intelligence, and smart tags).
Chartbeat’s main feature is an editorial dashboard, whereas Marfeel’s features include SEO, social monitoring, and personalization. Parse.ly’s strength is its depth: conversion analytics, data transparency, and making intelligence accessible across the entire newsroom.
Most analytics demos show dashboards.
This one shows answers.
A walkthrough built around your publishing workflow, your team, and the metrics that actually move your business.