


Google’s new Core Web Vitals (CWV) metrics have changed the way companies measure website performance, especially on WordPress sites. This makes measuring Core Web Vitals on WordPress tricky.
Google measures the performance of web pages in the wild not by running lab tests, but by looking at how pages perform on a subset of real users’ Chrome browsers across the world when they access them, as part of their regular browsing. The aggregate results for these metrics are exposed publicly in the Chrome User Experience (CrUX) Report, letting anyone see how well any of the origins included in the report is doing.
But the metrics can be confusing, especially when comparing results across different tools. Why do some tools report results as “good,” and others report the same website as “needs improvement” or even worse, “poor”?
Every website should keep an eye on its Core Web Vitals scores, and our marketing site wpvip.com is no different. Our pages reached the end of September with all Core Web Vitals metrics in perfect health, measuring good scores all around, when taken in aggregate. This means no performance red flags on user experience, as well as a full boost to Google Search ranking.

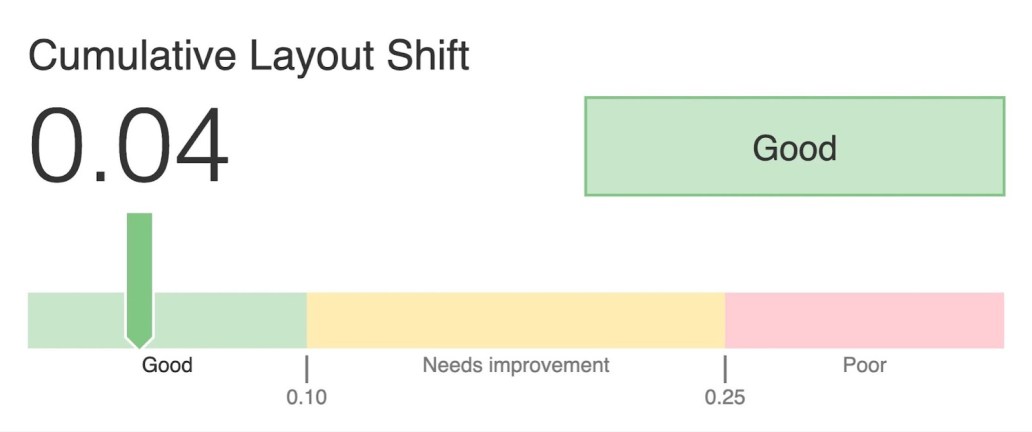
Because the results were an all-around pass, in aggregate, there is no Google Search ranking disadvantage for search results pointing to our landing pages. Results with good performance on every metric get the full CWV signal boost, regardless of where they sit within the range.
These results are exciting! However, when comparing them with the results from common tools like Lighthouse, the metrics don’t look so rosy:
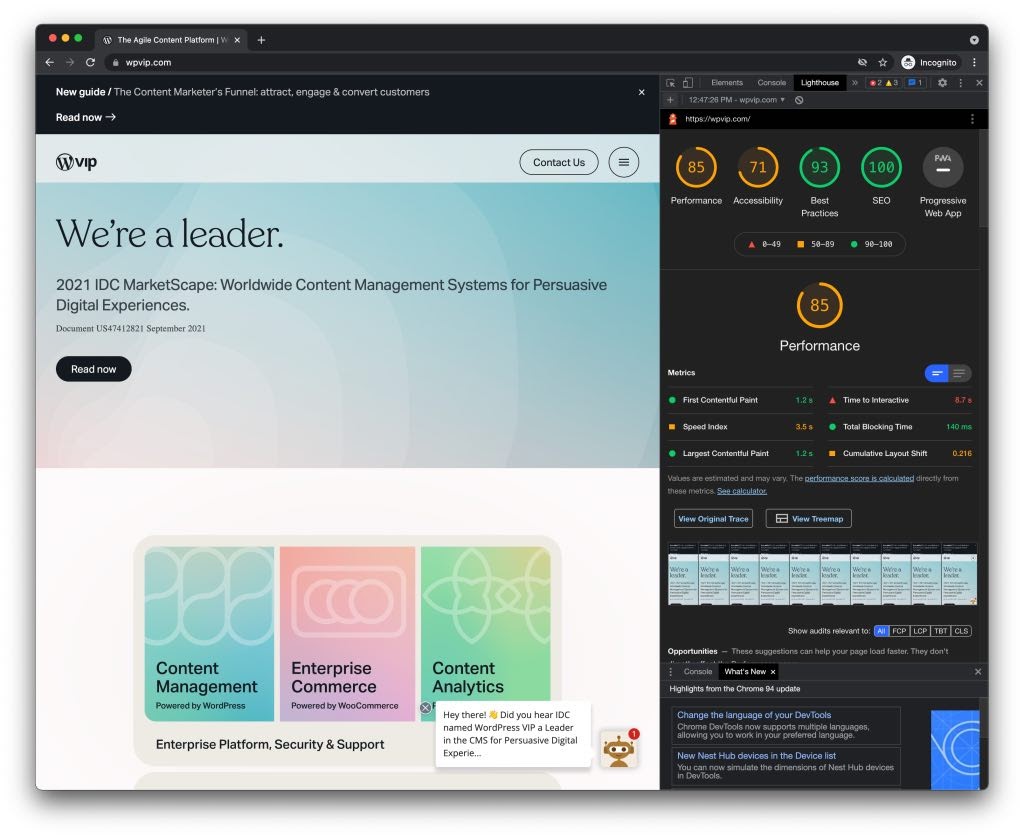
And the scanning tools at web.dev/measure give even less favorable results:
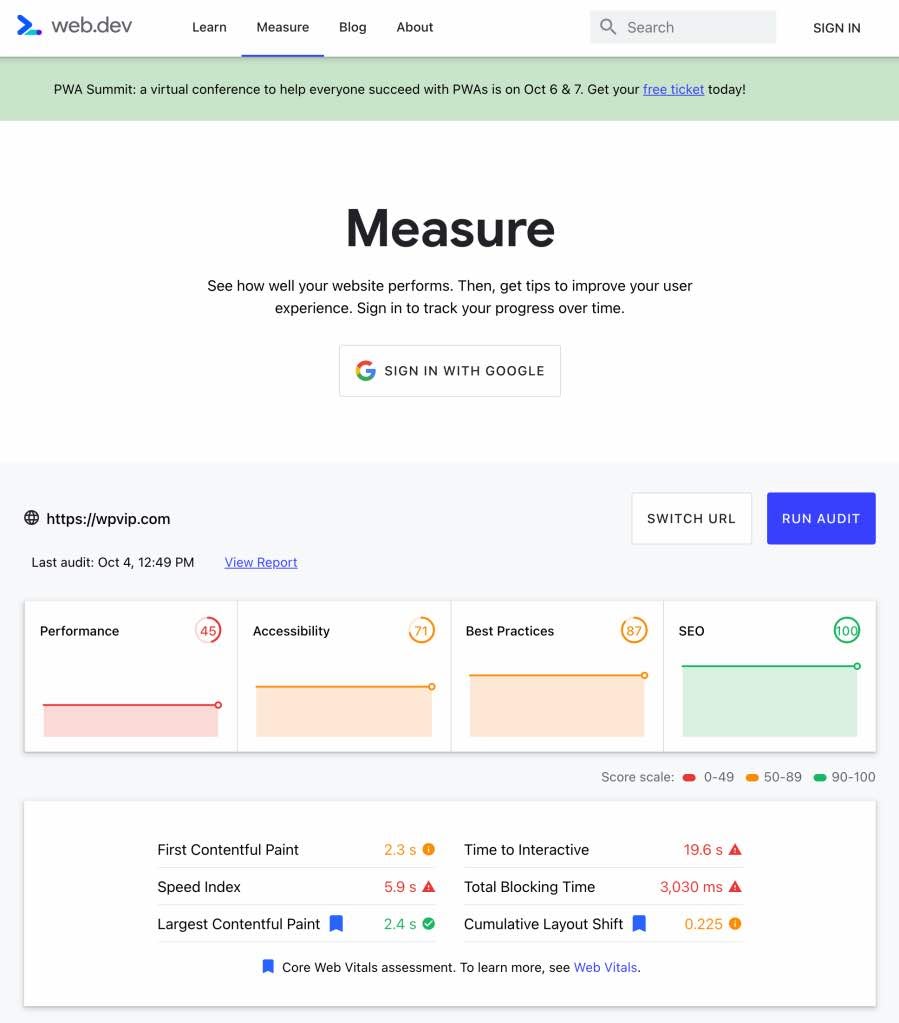
This is a common source of confusion, as the results between CrUX and Lighthouse (which web.dev/measure also uses under the hood) when measuring Core Web Vitals on WordPress can’t really be compared.
But why not?
When to use lab data vs. field data to measure Core Web Vitals
When trying to understand the difference between data sources, the most important distinction to make is between lab data and field data. Lab data refers to data obtained from synthetic tests, such as Lighthouse or WebPageTest, and is most useful when debugging problems and testing improvements. Field data, on the other hand, is data obtained from real users when they’re visiting sites; it’s Real User Metrics (RUM) data.
These are distinct data types that make use of the same metrics, so you always want to know what you’re looking at. Unfortunately, that’s not always clear. PageSpeed Insights, for example, shows both lab and field data confusingly interspersed in the same UI, the former from Lighthouse and the latter from CrUX.

How to use lab data to measure CWV
As mentioned, lab data is most useful for debugging issues and testing improvements. When working on your site’s performance, we recommend picking one tool and sticking to it, using the same settings between runs.
Our favorite is WebPageTest, which has a wide range of options you can change to suit your particular needs. Just make sure you’re using the same settings on all tests, and that you’re looking at the lab data (it also mixes the two):

Lighthouse is also a useful tool, but note that using it in two different settings doesn’t mean you’ll get comparable results. For example, while both PageSpeed Insights and web.dev/measure are hosted by Google and show lab data taken with Lighthouse, the values can vary wildly between them. You’re also likely to get variation if you test directly with your browser using different devices, or from different locations.
Note, while useful for development purposes, lab data isn’t used for Google search rankings. All data used there is field data from CrUX, because that more accurately represents user experience.
How to use field data to measure CWV
For keeping track of performance over time and understanding how your users actually experience your website, use field data. It can help you spot problems that you can further identify and test fixes for using lab-type tools.
The good news here is that Google automatically collects field data from a subset of Chrome users all over the world, as part of normal browser usage. These add up to thousands of measurements for a single page, from users in all sorts of conditions, which get aggregated into a single value that reflects the 75th percentile over a 28-day period. If your Core Web Vitals scores are changing slowly after you’re made improvements, that 28-day window is likely why!
But by writing “a single value,” I’m being somewhat simplistic. It gets a bit more complicated, because results are currently broken up according to device type (mobile, tablet, desktop) and effective connection type, and may even be broken down into further dimensions in the future.
To get this data, there are several options, depending on how you plan to consume and visualize it. PageSpeed Insights can get you current numbers for a single page or an entire origin, but it won’t have historical data. For that, Treo Site Speed (which is not a Google tool, but uses the public CrUX data) may help. The programmatic options are CrUX API or BigQuery to directly query the entire dataset.
Another option: run your own RUM infrastructure (or use a third-party RUM service) and capture your own data directly, instead of relying on CrUX. This will let you break things down differently and gather data at a much finer granularity. But this approach is more involved than simply making use of data on the CrUX report — assuming your origin is one of the ones it indexes.
Why CWV results vary so much
Now you can see why values can vary so much between different tools. Lab data will of course always be different from field data, but even within each of these categories, things can vary dramatically.
Here are possible reasons for different results when measuring Core Web Vitals on WordPress:
- Lab data measured using different infrastructure or from different locations.
- Lab data measured at different times of day, when services are more or less busy.
- Field data measured at different time periods.
- CrUX field data for different categories of devices, or an aggregate of all devices. Note: It may fail to capture part of your audience depending on device or browser choice.
- CrUX field data for a specific page (e.g., home page) or for the entire origin. Note: Often tools don’t make this clear.
Remember our internal report images at the beginning of the article? There we looked at the CrUX field data for all device and connection types, and for the entire origin, as reported on Sept. 30, 2021. Could we have used a different approach? Yes. No matter your choice, it’s key to always use the same criteria when comparing values across runs or over time.
Learn more about Core Web Vitals
For a broader look at CWV and optimizing your site, check out our Core Web Vitals FAQ and recent Optimizing for Core Web Vitals webinar.
Author

Sérgio Gomes
Web Performance Engineer, Automattic