


Enter web analytics tools.
Web analytics tools can help you find the answer to nearly any question about your website or customers. But there are a lot of tools to choose from today, and they’re all very tempting. And while you will probably need more than one, you may not need as many as you think. It can be tricky to nail down which ones you need the most.
So, let’s look at all the major types of web analytics tools, some popular examples, and how to know when you need them.
What web analytics tools do
Web analytics tools collect data to show you how visitors arrive at your website and what they do once they’re there. These tools let you compare data over time to see patterns. This data also lets you measure performance against benchmarks and goals to see how your website is performing, where performance can be improved, and the effects of the actions you take to improve it.
Some of the things that website analytics tools can tell you include:
- How do people find your site? What do they do after they get there?
- Which content on your site do people engage with? When and how are they engaging with it?
- Why do some people buy and others don’t? How can you get more of them to take action?
Some analytics programs also include data from social media and mobile apps, overlapping with the broader category of digital analytics.
Google Analytics—the most popular web analytics too
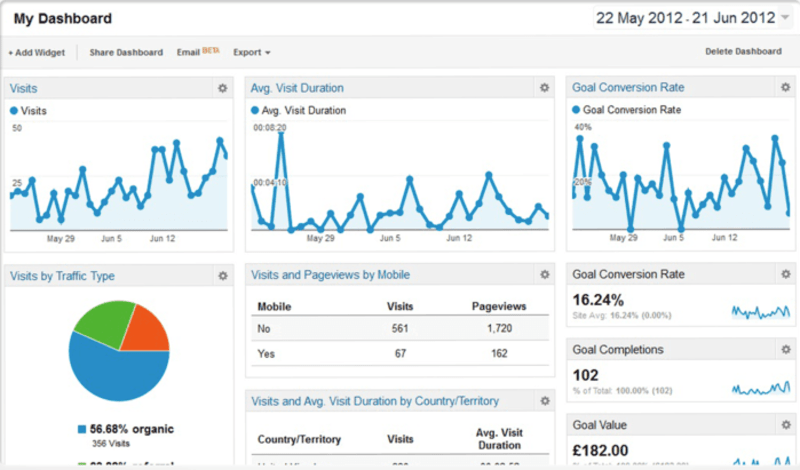
Many businesses start with Google Analytics. It’s the most popular solution for web analytics. Over 29 million websites use it. It’s free and robust enough for many small businesses. Using Google Analytics, you can understand which channels bring you website traffic and see metrics like pageviews, unique pageviews, average time on page, and bounce rate. But no one tool can measure everything you want to know. Businesses often use a combination of supplementary tools on top of one primary tool. In fact, we see most of our customers using Parse.ly and Google Analytics in tandem for this reason.
When do you need more than Google Analytics?
Google Analytics is a powerful tool, but it’s not always easy to get answers from it. As your digital marketing strategies become more sophisticated, you may need to find tools that make content performance data easier to access.
When you need data to be packaged differently
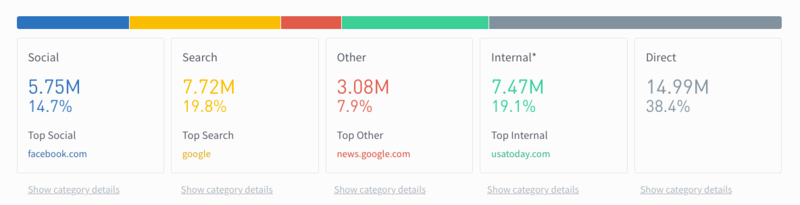
Google Analytics also gives little insight into true engagement with your website. Because of how Google Analytics collects the data, bounce rate and time-on-page metrics don’t tell the real story. For example, a reader is counted as a bounce, whether they spend 15 seconds or two minutes on a page. And time on site is not recorded for people who only visit one page on your site, which can be up to 70% of your visitors.Social media traffic is also difficult to understand in Google Analytics. It’s often lumped into the direct traffic category. And there’s no way to see which social posts or users bring in web traffic.
When you want an analytics program that everyone can easily understand
Google Analytics is also hard to use for those without deep technical expertise. And the switch to Google Analytics 4 is not getting any better. Users, such as writers on your content team, avoid it even when they can benefit from understanding performance data. Online publisher Slate realized this when it wanted to get everyone on its team aligned around the goal of engaging readers to build a loyal audience. To do this, audience data must be made more accessible to product managers, journalists, and analysts. Its answer was to use a dedicated content analytics platform, Parse.ly.
When you want data that Google Analytics just doesn’t offer
In addition, there will be times when you want more information about your users than Google Analytics can offer. Other types of web analytics tools will be much more suitable for things like running tests and getting to know your users and how they use your website or app.
Here are nine types of web analytics tools and when they come in handy.
1. Content analytics tools
Content marketing teams are catching onto what media publishers have known for years: if you’re publishing a lot of content, you’d better have a good measurement system. Given how difficult it can be for content-oriented people to wade through tools like Google Analytics, it’s no surprise that content analytics has emerged as a new category of web analytics tools.
These tools help content teams measure how audiences consume and share their content. The resulting data helps them understand how to engage their readers better and stimulate conversions.
Parse.ly
Parse.ly is a content marketing analytics platform designed specifically for measuring the performance of content. It offers an alternative to general-purpose web analytics tools for content teams to find valuable insights that help them make decisions.
Content teams can see real-time and historical data in a central dashboard and easily sort and filter it by type, author, channel, source, and more. Everyone on the content team, from directors to editors to writers, can use it easily.
Parse.ly’s approach to measuring content deviates from the generalized approach, which relies heavily on metrics like bounce rate. Instead, it measures engaged time via a “heartbeat” to produce a metric called engaged minutes. This measures continuous engaged time across videos and interactive content, which is conspicuously missing from most tools like Google Analytics.
Parse.ly also pulls in data from external channels like social media (Facebook, X, LinkedIn, Pinterest, Reddit, Instagram), search engines (Google, Bing, Yahoo!, Yandex), and platforms like web, mobile, Apple News, Facebook Instant Articles, Google AMP, SmartNews, iOS, and Android apps to give a comprehensive picture of content performance.
One of the add-ons available from Parse.ly shows conversions and attributions for actions, such as newsletter signups, subscriptions, registrations, lead captures, and ecommerce sales. See more resources and how to get started with content analytics.
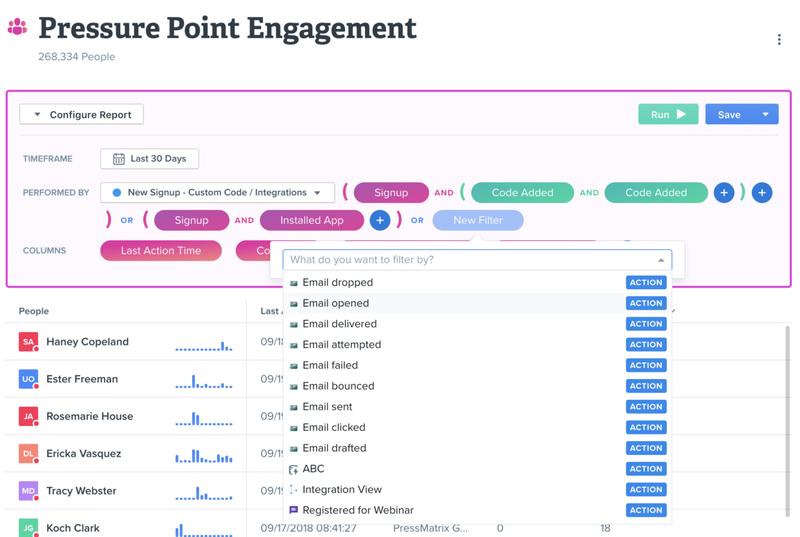
2. Customer analytics tools
Customer analytics tools go deeper into customer behavior than general web analytics tools. These tools pull in customer data from various mediums like web, mobile, email, and your product. You can create segments based on behavioral patterns and then predict and offer the products and services those distinct groups of customers might buy.
Kissmetrics
Kissmetrics excels in customer data for ecommerce and SaaS companies. Both product and marketing teams can benefit from data on power users and other cohorts, insights into which features are most popular, and where your best customers come from. It helps identify groups of customers who spend more and make repeat purchases, as well as the products and offers they respond to.

Kissmetrics includes advanced business intelligence (BI) reporting that can query the raw data directly with SQL. The company has helped more than 10,000 companies with $10 billion in transaction volume. Learn how Kissmetrics differs from Google Analytics.
Woopra
Woopra is a less pricey alternative that shows what customers do between hearing of you, visiting your site, and leaving or taking another action.
It creates profiles for each individual visitor, taking into account their activity on your website, email, social media, paid media, sales, technical support, help desk, and video, as well as their engagement with your product. This is useful for marketing, sales, and product teams.
The tool also automatically deploys changes on your site based on triggers to help nudge customers along. Custom scripts let you display discount messages or newsletter opt-ins based on actions by the customer that you set as triggers. Learn more on the Woopra blog and see what it takes to get started.
3. Usability (UX) analytics tools
Usability analytics tools are specialized tools that let businesses analyze what users do on a page. They record how people interact with the page and its elements so an online marketing or product team can evaluate how different features are received.
With these insights, businesses can make changes to the page or user interface and measure user behavior to see how those changes play out.
Crazy Egg
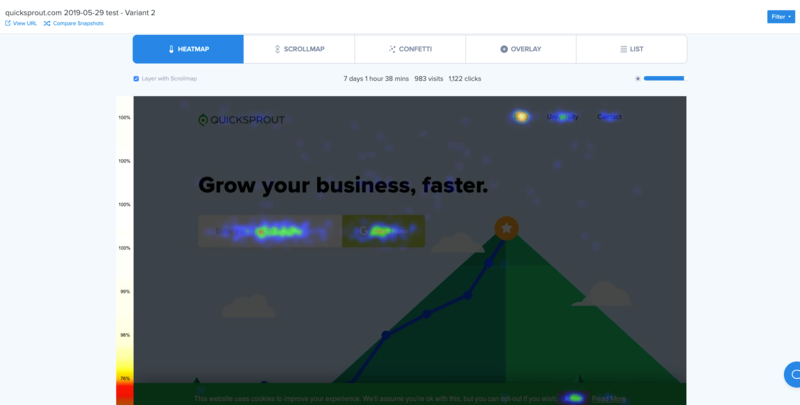
Crazy Egg focuses entirely on measuring how users navigate your website and landing pages. It’s especially handy for optimizing conversion rates on pages where you want users to take action. It offers several technologies to help you understand how users navigate your website, including heatmaps, scrollmaps, click reports, and user session recordings.
Crazy Egg also offers A/B testing, which allows you to compare heatmaps and data before and after changes to your web pages, for example. For more information, check out the Crazy Egg blog and documentation.
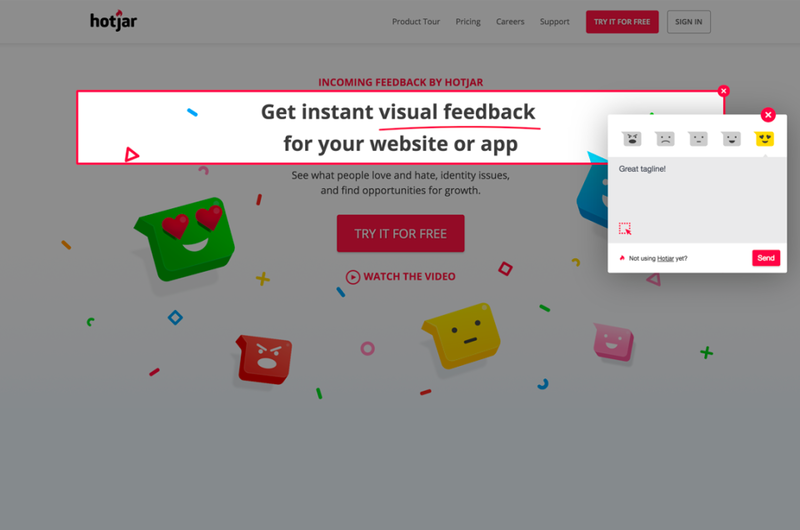
Hotjar
Hotjar allows you to collect actionable feedback from users in addition to data from heatmaps and visitor data recordings. You can use polls, surveys, and live feedback chat to query people on your website. This adds a qualitative dimension to the UX data you can collect, which is typically missing from other usability web analytics.
Hotjar does not offer A/B testing like Crazy Egg, but you can monitor pre-existing A/B tests. That means Hotjar could work for you if you already use a different tool that offers A/B testing. Check out its resources page and what you need to get started.
Parse.ly Overlay
Content analytics reveal that a publisher’s story has high engagement on channels like search and social. That makes it a must to showcase it prominently on your homepage. But how does its performance stack up against others already featured there?
Rather than relying on intuition about reader preferences, the Parse.ly Overlay provides a clear, visual representation using real-time data. Acting as a dynamic heat map, it highlights how a current post is performing relative to the average, allowing for quick insights.
The Overlay also facilitates other data-driven decisions. For instance, should a story occupy the top position or be more effective in the right sidebar based on audience demand? This analytics tool is a powerful asset for news organizations aiming to capitalize on breaking news and maintain audience engagement.
4. A/B and multivariate testing tools
You can run the occasional simple A/B test using a general web analytics tool. However, if you plan to test and optimize elements of your website regularly, you will benefit from a dedicated testing tool.
And if you plan to run multivariate testing, which tests multiple variables on a page at once, you’ll definitely need a tool like one of the following to accurately interpret results.
Optimizely
Optimizely offers testing analytics software to help businesses experiment and continuously improve their products and websites. It’s used by engineers, product managers, marketers, and data scientists and also has a reputation for catering to software developers more than the other tools in this class. That said, in the past, reviewers have said that it’s simple to set up tests even with no technical know-how.
Optimizely notably includes a visual web editor, customer journey experimentation, and real-time analytics data. See Optimizely’s resource library and how to start using it.
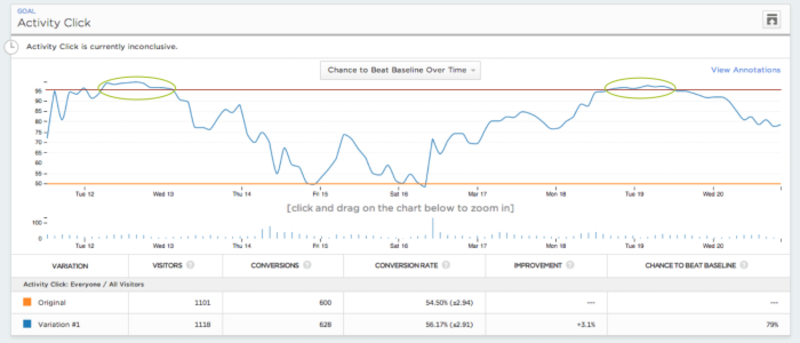
Adobe Target
This tool is the way to go if you are already using the Adobe marketing stack and want the best tool to integrate with Adobe Analytics. It offers a very comprehensive list of capabilities. Adobe Target lets you build tests across other digital channels besides your website and app, including mobile and email.
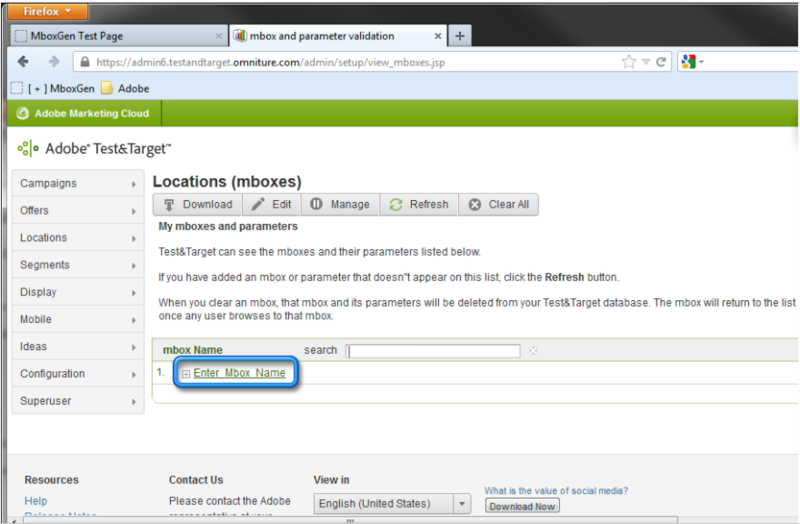
In fact, you can also set up personalized elements to deploy for users based on rules, profiles/segmentation, and behavioral targeting. See more on its resources page and learn about getting started.
5. Social media analytics tools
Social web analytics tools are important for businesses focused on growing audiences and engagement on social media.
While other tools may offer some features to help with this—for example, Parse.ly includes social media data for your content—you’ll need a dedicated tool if your business depends heavily on social media engagement. Some social analytics tools provide analysis only, while others let you manage your posts, too.
Sprout Social
Sprout Social is an all-in-one social media management platform. You can use it to schedule and publish social media posts and monitor campaign performance. Keep your eye on keywords and hashtags, analyze your follower base, and even track paid marketing campaigns using the tool’s key features.
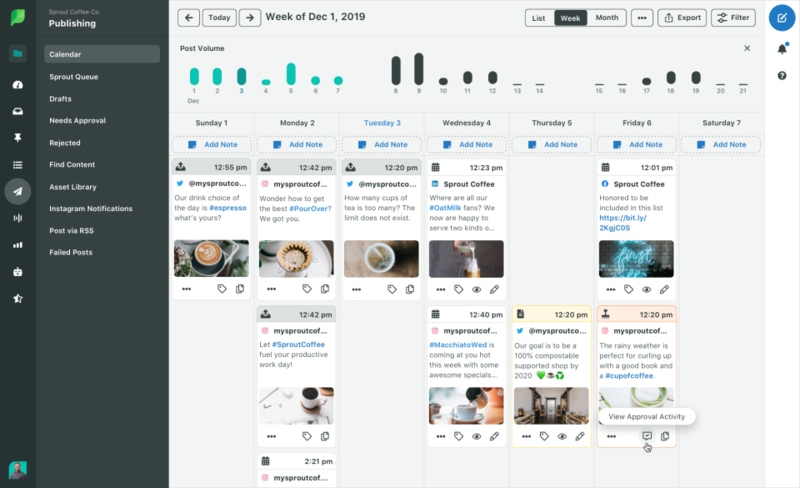
Sprout Social lets you compare your performance on social media to that of your competitors. Its social media analytics surface insights on both the industry and the brand level, which you can apply to your product and business strategy. See more resources and how to get started.
BuzzSumo
BuzzSumo is a social media research tool. It helps you analyze content to see what’s gaining buzz in your industry. It shows what content readers respond to on social media, including what competitors are doing. BuzzSumo is helpful for digging up topics in your industry, seeing whose content is most popular, and finding targets for backlink and influencer outreach efforts.
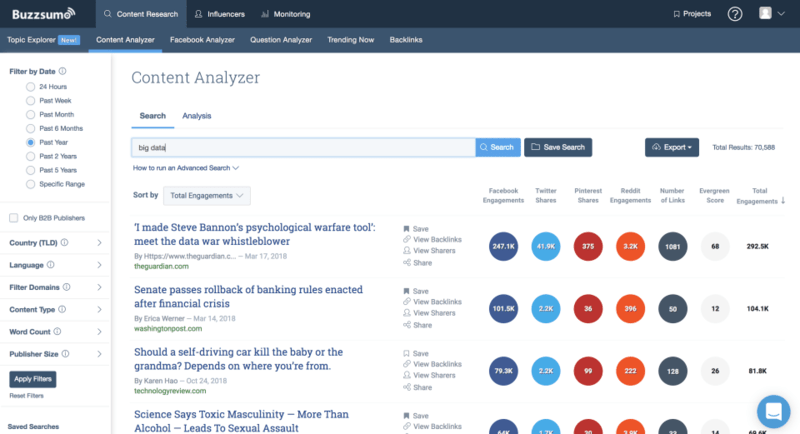
BuzzSumo also offers social media monitoring with alerts and an API to let you customize and integrate it into applications. Check out the BuzzSumo blog and documentation to get started.
6. SEO analytics tools
If you use search engine optimization to attract traffic from search engines, you need a specialized SEO tool in your web analytics tool stack.
These tools provide data on keywords to point out new opportunities to gain traffic. They also give you data on backlinks pointing to a website. This is key because the number and quality of links pointing to a website are an important ranking factor for Google.
Ahrefs
Ahrefs is a popular SEO analytics tool that offers both keyword research and backlink analysis, though backlink analysis is Ahrefs’ bread and butter feature.
With the Ahrefs tool, you can see information about links pointing to any website. This includes data like the number of links over time, the quality of those links, and exactly which pages on a website link to yours. With this information, the SEO team can work to improve the website’s backlink profile.

In addition to providing solid backlink data analysis, the tool is popular among SEO teams for keyword research. Learn more with Ahrefs’ resources page and check out popular questions about the tool.
Alexa
Alexa, owned by Amazon and best known for its Alexa Rank metric, combines competitor intelligence with SEO and website analytics. Alexa’s suite of tools includes backlink research, keyword research, site audits, and brand strength metrics. It also provides a unique feature showing you the likelihood that your site can rank for any given keyword, which is a great help when determining target keyword priorities.
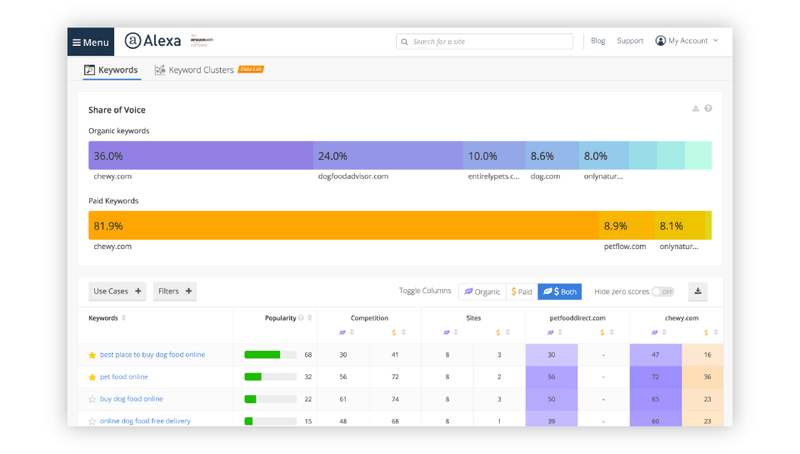
Alexa excels at competitor research and target audience analysis in the context of SEO. It gives a snapshot of related websites in an industry. Then, it lets the user drill down to analyze websites by traffic sources, bounce rate, social engagement, backlinks, and keywords, among other factors. Learn more here.
7. General enterprise analytics tools
Businesses dealing with large amounts of data face unique challenges and thus need tools designed to handle them.
Enterprise-level web analytics tools are solutions designed especially for businesses with massive amounts of data—visitors in the hundreds of thousands or millions per month. At that point, you start to face challenges in separating the valuable data from the noise, data inaccuracies, and sampling errors and gaining the insights you need in a timely manner.
Parse.ly is an enterprise-level content analytics platform built for large content teams. However, depending on your teams’ other activities, you may want to supplement it with a general enterprise analytics tool like the following.
Google Analytics 360
Google Analytics 360 is the premium version of Google Analytics. It includes advanced features suited to websites with large numbers of users.
This includes unsampled analytics data, meaning that, unlike regular Google Analytics, reports are all based on actual data rather than data samples for greater accuracy. This enterprise-level web analytics tool integrates with other Google platforms, like Google Ads, and third-party tools, like the Salesforce Marketing Cloud. This opens up opportunities for campaign insights and remarketing.
Google Analytics 360 also offers advanced attribution modeling, which means a marketing team can use a more sophisticated way to measure the impact of various channels and touchpoints that lead up to a conversion. Learn more about Google Analytics 360.
Adobe Analytics
Adobe also offers an enterprise-level web analytics suite of tools. This solution is particularly useful for organizations that use Adobe Cloud and Adobe Target because it integrates easily with tools in the Adobe suite.
Fans say that its drag-and-drop reporting interface is easy to use. Like Google Analytics 360, Adobe Analytics can handle large volumes of data with no data sampling. But it also goes beyond Google Analytics 360’s website-only focus.
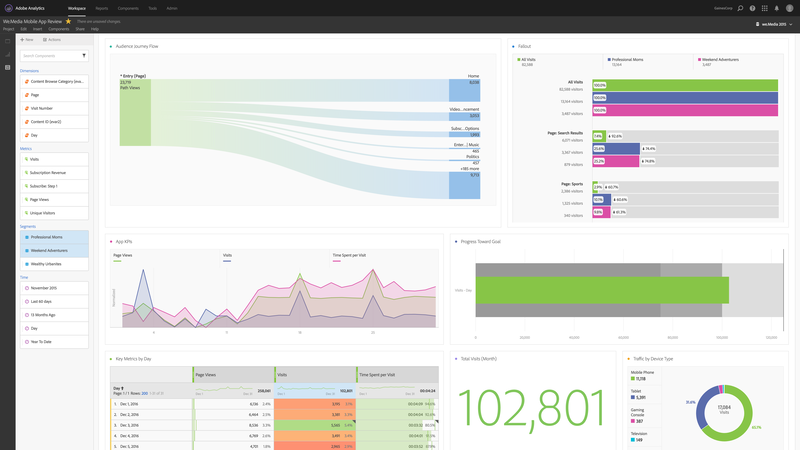
The platform also incorporates Adobe Sensei, which brings some benefits, like a reduced time to discover statistically valid segments of customers. Data can be “activated” into marketing workflows, meaning the platform can deploy audience segmentation, content optimization, and personalization of the website visitor’s experience. The platform also allows broad data collection, even outside Adobe properties. Read more on Adobe Analytics resources and see what you need to get started.
HubSpot
Everything that’s measured is bound to grow. With HubSpot’s marketing analytics, you can measure and manage all your marketing-related data in one place and plan how it can translate to revenue.
Simply add your website’s tracking code and let HubSpot do its magic. The Marketing Analytics & Dashboard Software collects essential data for you to make informed decisions. You can set automations based on the visitor’s behavior and trigger workflows that convert into sales or leads.

If you rely on organic traffic to your website, you can measure the visitors with the tool. This helps you measure the quality of the visitors visiting your website. To improve the marketing campaigns, you can calculate the conversion rate based on the number of visitors’ sessions. You can even identify key sources that get maximum conversions and focus only on those sources to generate leads or make more revenue.
You can get detailed marketing reports for all your operating channels. You can also view detailed reports related to all your social media campaigns, blogs, and emails in one place.
The dashboard’s visually appealing data is helpful and insightful for various teams to leverage. Lastly, as soon as you set up the marketing campaigns, the analytics dashboard starts collecting data for those campaigns. This is for those who don’t have the technical expertise to set up the campaign from scratch. Get started with HubSpot.
8. Open-source web analytics tools
Open source web analytics tools give you more freedom and control over your data than cloud-hosted solutions like those above.
Your IT team can use and modify the source code to build your own customized in-house software so you can store and analyze data how you prefer. This type of software is all on-premise because you will store it—and all the data in it — on your own servers. You are then responsible for maintaining and updating the software, too.
Among open source web analytics tools, two options stand out.
Matomo (formerly Piwik)
Matomo offers open source code with the freedom to modify it and share improvements among a vibrant community of developers. The software provides a general analytics solution and other more specialized features, like conversion funnels, visitor profiles, enhanced SEO, heatmaps, A/B testing, and intranet analytics.
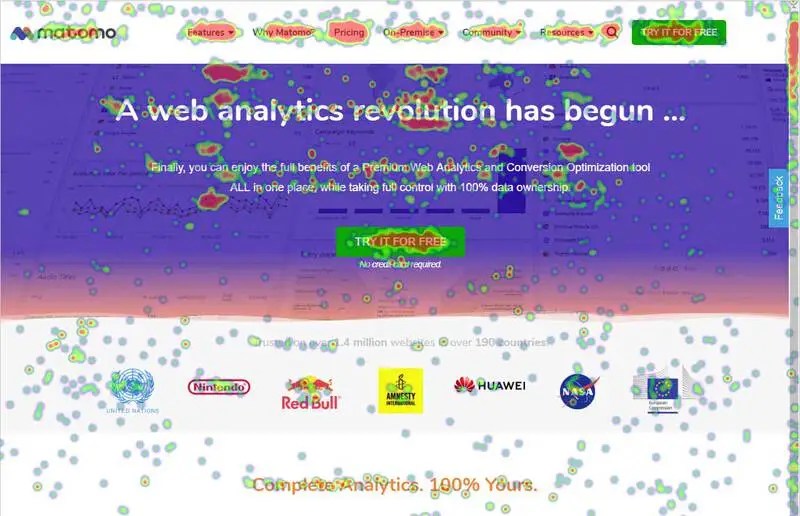
Matomo also doesn’t use data sampling, which other tools like Google Analytics do. You can choose between cloud installation, which requires a subscription like the other analytics tools mentioned above, or on-premise, which means you can install the software on your own server and make it your own. Either way, all the data belongs to you.
Open Web Analytics
Close behind Matomo in terms of popularity, Open Web Analytics also offers many of the features you’d hope for in an open source all-in-one web analytics tool, plus a few more. Notably, this solution lets you see where people click on a page and how often people visit to measure loyalty. You can track an unlimited number of custom site actions.
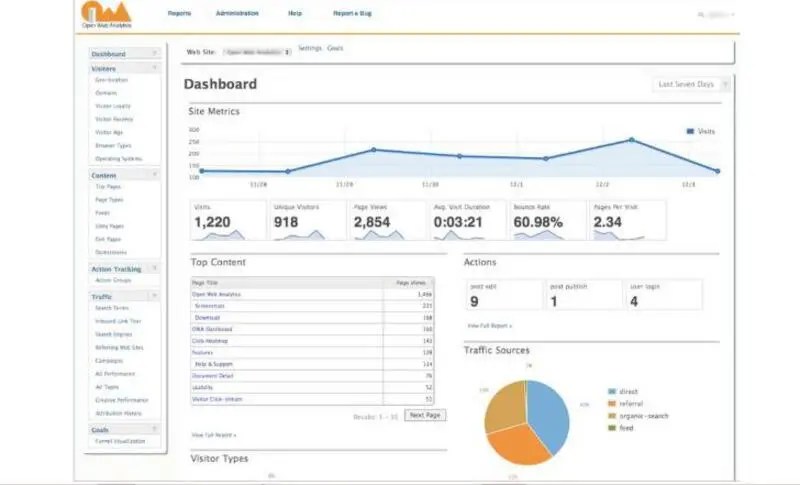
The software provides dozens of standard metrics, dimensions, and reports. Even though it’s a free tool, remember you’ll need IT resources to set it up and keep it working. View demos here.
9. Product analytics tools
Product analytics tools measure how people interact with and use a digital technology product or app rather than a website.
Product development teams use these analytics tools to improve the user experience. They can see if users are interacting with a new feature, for example, or if it’s causing friction for them, and then make changes accordingly. Some product analytics tools also measure data from your website in addition to that of your product.
Mixpanel
Mixpanel offers product analytics tools in addition to more general web analytics tools. Its product-focused tools pull out data on how customers are using a product in real time, highlighting trends over time. Automated analysis tools help product managers understand why those trends may be occurring. To continually improve the product, the team can set up cohorts of users and test how product changes resonate with those users.
According to information on Capterra, over 26,000 companies—including 30% of The Fortune 100—use Mixpanel. Customers say that they appreciate being able to run tests without involving developers. See their resources and how to get started.
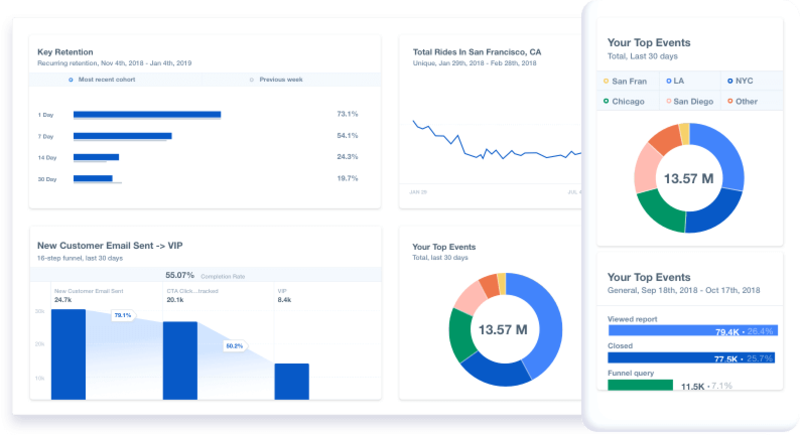
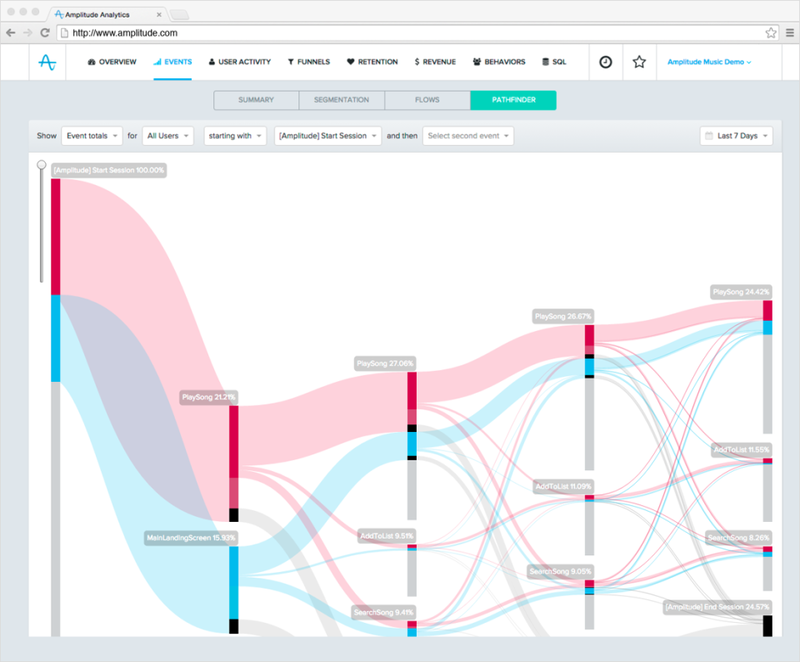
Amplitude
Like Mixpanel, Amplitude offers self-serve product analysis, so you use a data-driven product strategy without technical know-how.
However, unlike Mixpanel, Amplitude is entirely focused on product analytics. Its data collection and analysis extend through the entire user flow from onboarding through trial, purchase, use, and churn. It maps out all the possible steps customers take to find points with high drop-offs in the product. These point to changes you can make for a big impact.
One of the company’s core beliefs behind the tool revolves around finding and tracking a North Star Metric for your product. This means aligning the team and their efforts around one measurement that is key to product success.
The company says more than 30,000 teams use Amplitude to grow their digital businesses. Check out the Amplitude resources library, blog, and tools to get started.
10. Data visualization tools
So, you’ve collected or have access to digital reams of data related to how users interact with your site, content, and marketing channels—from multiple sources, systems, and tools. Understanding it all, especially from a high-level business perspective, can be a real challenge.
Data visualization is the graphical representation of information and data using visual elements like charts, graphs, and maps. By curating data from sources like SQL databases, cloud-based data, and online services like Google Analytics and Salesforce into an understandable form, these digital tools help analytics users see and understand trends, outliers, and patterns in data.
Parse.ly Data Pipeline
Before we discuss popular visualization tools, we need to mention an important link to content analytics. Parse.ly’s Data Pipeline enables your team to analyze and act on large amounts of raw content data, including custom event data, as it’s generated.
That data is stored so that you can do historical analysis, too. In effect, we clean and transform the data for you, letting your BI and Data Science teams concentrate on analysis. With all this data in hand, our customers can join it with other data systems already in use, feeding it into popular visualization tools like Tableau, Microsoft PowerBI, Looker, Periscopic, and more.
Tableau
Probably the best-known data visualization and business intelligence platform, Tableau transforms raw data into interactive dashboards. It allows users to create visualizations like bar charts and line graphs without programming skills.
With a drag-and-drop interface, Tableau connects to various data sources, enabling quick data analysis. It efficiently handles large data volumes, providing real-time insights for data-driven decision-making. Tableau’s dynamic visualizations help uncover patterns and trends, making it invaluable for businesses and analysts seeking strategic advantages. Learn more on their blog and how to get started.
Microsoft Power BI
Much like Tableau, Microsoft Power BI is a business intelligence (BI) tool that also enables users to visualize and share insights through interactive dashboards and reports. It also connects to various data sources, allowing for data consolidation and analysis.
With a user-friendly interface, Power BI facilitates the creation of visualizations without extensive coding. It supports real-time data updates, aiding informed decision-making. Power BI’s integration and data modeling features empower organizations to transform raw data into actionable insights, enhancing strategic planning. Learn more on their blog and getting started.
Looker Studio
Looker Studio, a free data visualization tool formerly Google Data Studio, was acquired in 2019 by Google and integrated its capabilities into its suite of data tools.
As you might expect, it allows users to connect to various data sources, such as data from Google services like Google Analytics, Google Sheets, and other third-party platforms, transforming raw data into visually appealing and informative reports.
Like other tools in this category, Looker Studio enables users to customize visualizations to highlight key metrics and trends, making complex data more accessible and understandable.
Sisense for Cloud Data Teams
Formerly known as Periscope Data, Sisense for Cloud Data Teams stands out from other visualization tools by offering advanced data modeling and transformation capabilities tailored for cloud environments.
It integrates seamlessly with various cloud data sources, enabling real-time data exploration and visualization. The platform emphasizes collaboration, allowing teams to share insights and dashboards easily. Its focus on scalability and performance ensures efficient processing and visualization of large data volumes, making it ideal for organizations leveraging cloud data for strategic decisions. Learn more on their blog and getting started.
Which are the best web analytics tools for you?
As you can see, there are many web analytics tools—and the information that each provides is attractive. Who doesn’t want to know as much as they can about their customers?
But adding more tools isn’t always better. Tool fatigue can detract from their usefulness because each tool you add also adds a cost—in the form of time, money, and your attention.
So, how can you know which web analytics tools are best for you?
The short answer is that it comes down to your team’s priorities. If you’re still a small business, you may only need one tool, like Google Analytics. If you’re focused on growing via SEO, then equip your team with a specialized SEO tool. If you’ve reached scale with your content marketing and want to improve your ROI, then it’s time to consider a dedicated content marketing analytics tool like Parse.ly.
Talk to a content analytics expert at Parse.ly today.
Author

Greg Ogarrio, Content Marketer—WordPress VIP