


One consistent content publishing challenge is connecting the dots between how readers find your content, how they engage with it, and how that engagement leads to a conversion event like a subscription or purchase. The data is often fragmented in multiple systems without a clear visualization of how users move from discovery through conversion.
Tools like Adobe Analytics and Google Analytics can help with this understanding, but they require setup time and a level of expertise in understanding how analytics tools work to achieve meaningful insights.
With the release of Parse.ly Journeys, WordPress VIP provides deeper understanding of content performance by connecting acquisition data with engagement and conversion data natively without the need for complex configuration.
Challenges of mapping customer acquisition to conversion
When traffic source and content performance data are decoupled from conversion data, it can be difficult to understand which content is leading to desired outcomes. This leads to missed opportunities to produce additional content on a specific topic or type of content that’s performing well. It also makes it challenging to know which content to avoid.
It’s possible to piece together the pathways that lead to conversion through manual analysis across campaigns, Google Search Console data, and conversion data, but that can be time-consuming, making it difficult to react quickly.
Without a full understanding of a user’s journey from point of discovery, through content engagement, and ultimately conversion, it’s also difficult to make accurate comparisons of organic, paid, and social media acquisition efforts.
How Parse.ly Journeys simplifies journey mapping
Parse.ly Journeys eliminates all the key challenges associated with mapping the pathway from customer acquisition to conversion.
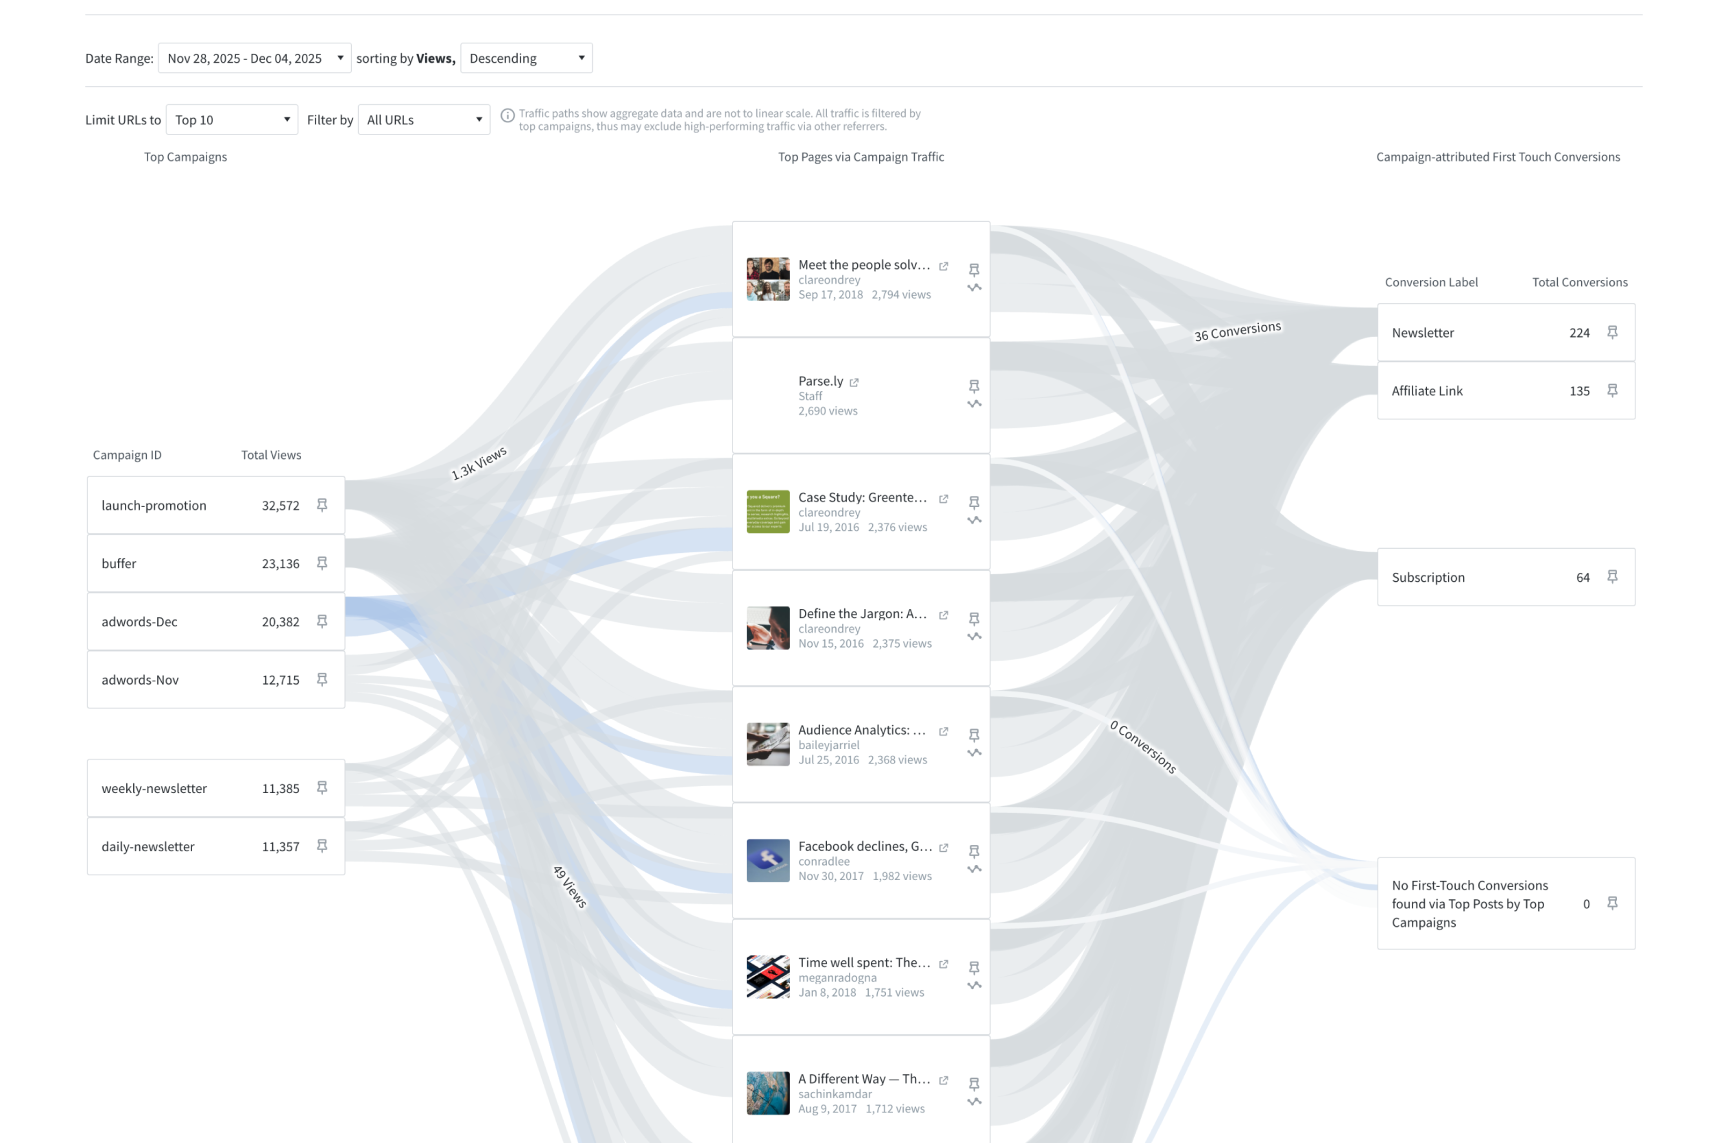
Interactive reader path visualization
Audience journeys are displayed in a Sankey visualization, starting from the acquisition source, through initial content interaction, and ending with conversion when it occurs. It combines Campaigns, Google Search Console, and Conversion data in a single view. Audience journeys are visible for up to 91 days. And they can be sorted by traffic source, conversion type, or content performance.
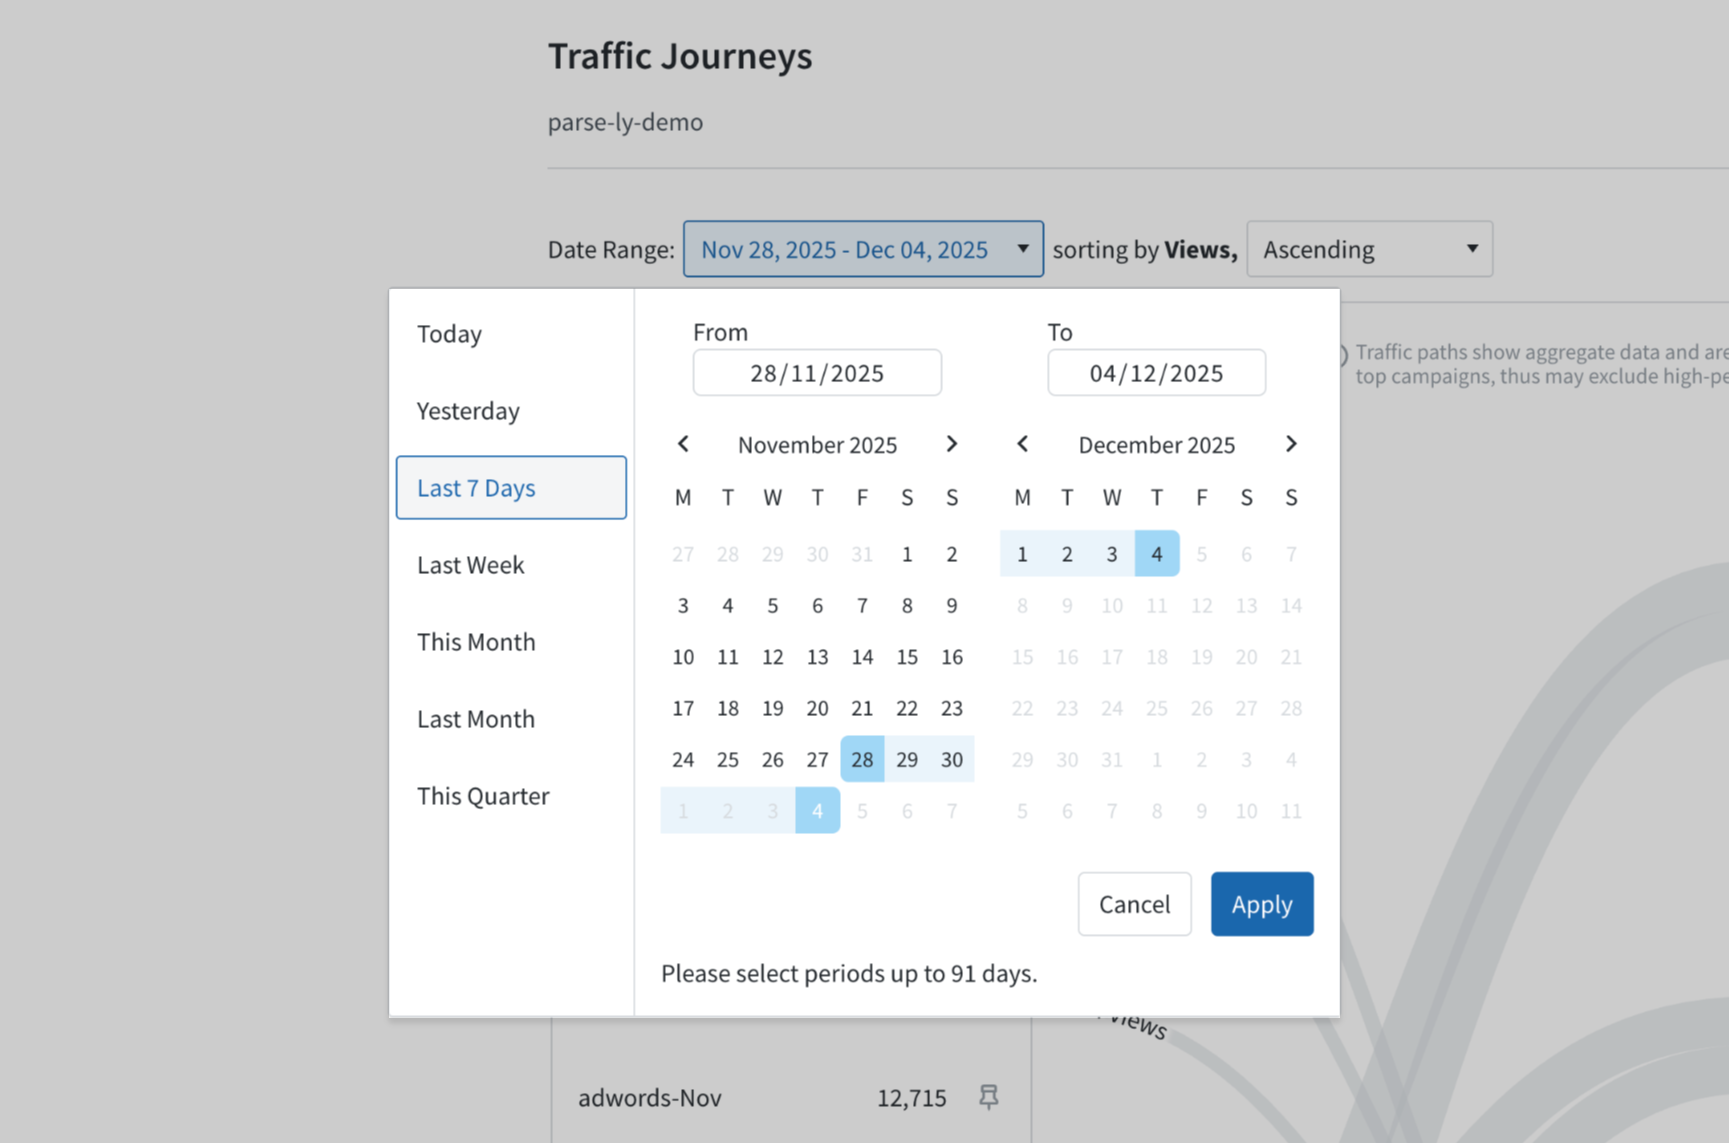
Flexible analysis and filtering
User content journeys can be filtered by segment, timeframe, and level of performance. You can easily toggle between top-performing and lowest-performing content or channels to get a clear view of what’s working (and just as importantly, what isn’t). Date ranges can be expanded to help isolate content based on what’s converting and what isn’t.
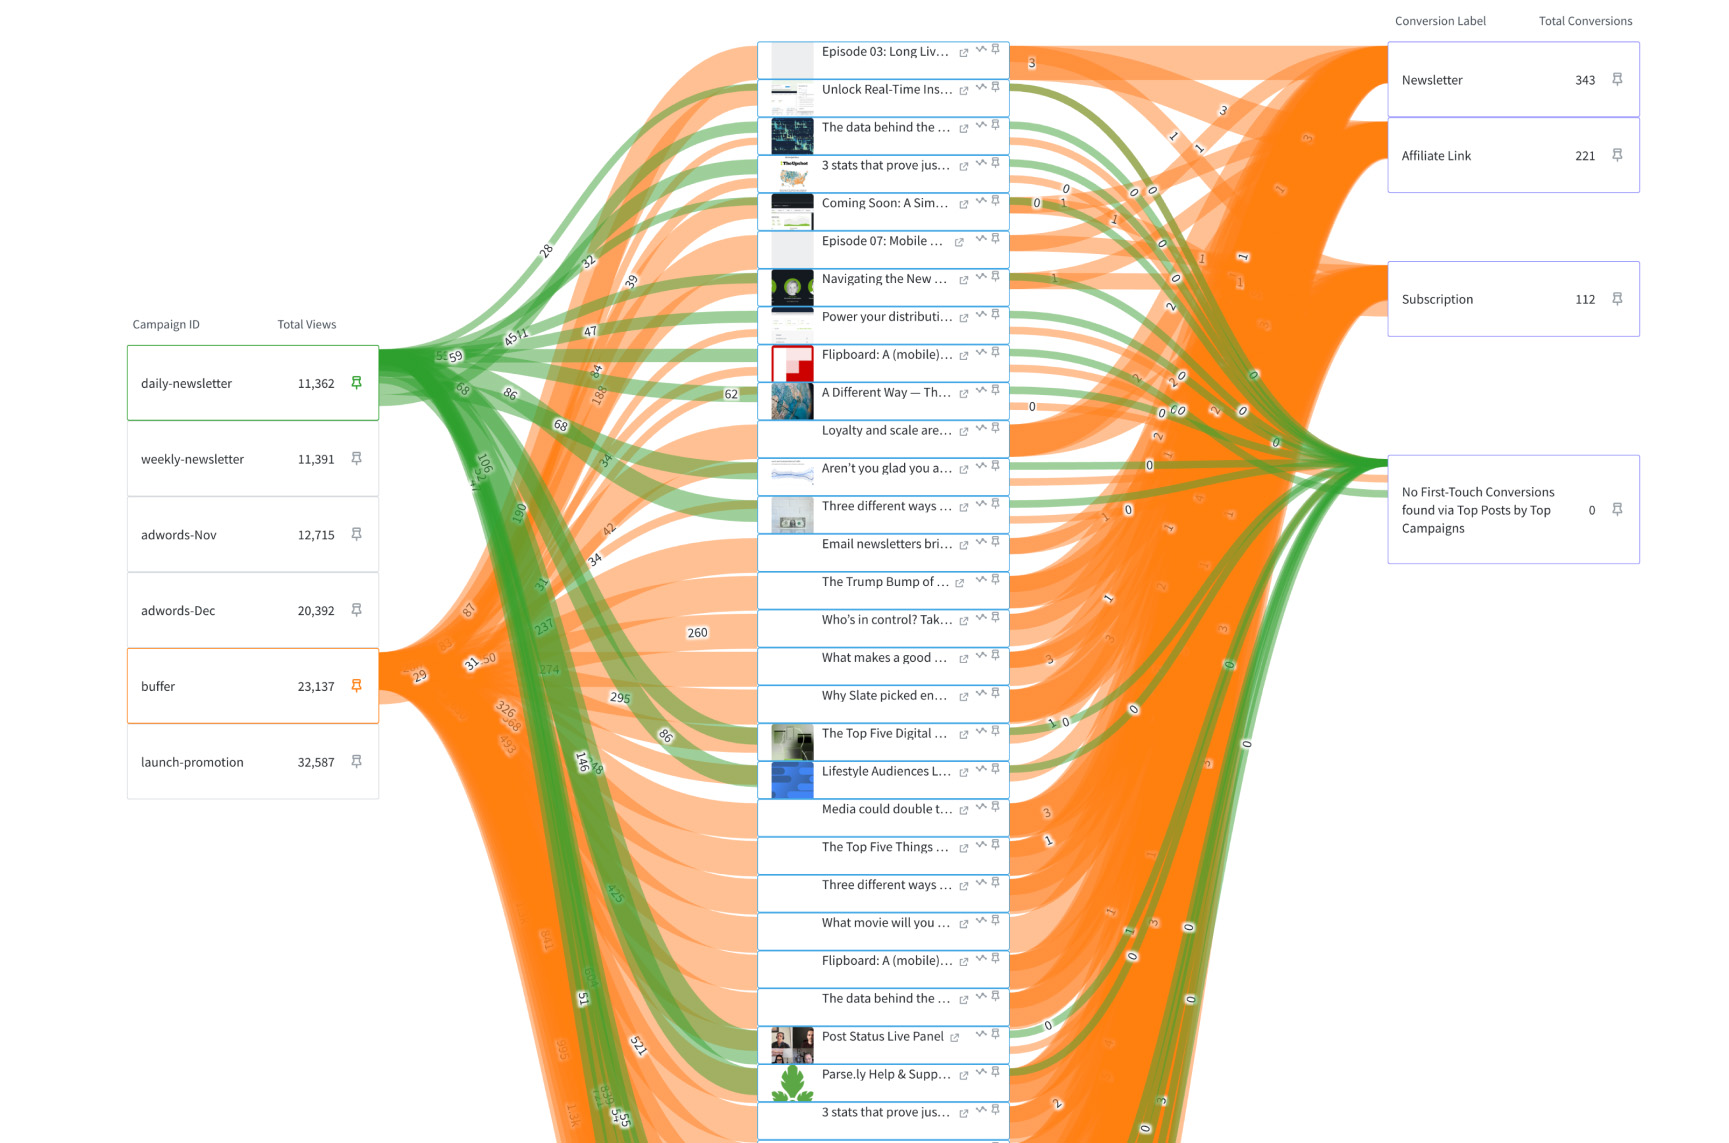
Path comparison and pinning
If there are specific journeys that warrant a deeper dive, you can pin them in the visualization. It’s also possible to compare acquisition and conversion outcomes side-by-side to better understand subtle differences between two different journeys.
Accessible and intuitive experience
All of the Parse.ly Journeys experience is built directly into the Parse.ly interface. There’s no setup, no coding, or dashboard customization required to take advantage of the data. This eliminates any barrier to entry for marketing, analytics, and content teams to make use of the aggregated information.
Parse.ly Journeys helps you connect the dots
Parse.ly Journeys eliminate data fragmentation with a unified view of user acquisition, engagement, and conversion data, saving time in aggregating data from multiple data sources.
Intuitive visualization provides immediate data literacy so that everyone in your team can understand what’s working and what isn’t. That additional clarity translates to faster response times when you want to refine your content strategy.
If you are already a Parse.ly customer, you can start taking advantage of Journeys today. If you’re not already a Parse.ly customer, the team would be happy to show you how Journeys can help you understand user pathways from initial discovery to conversion.
Related content

Understanding Google Referral Traffic in 2025
Author

Jake Ludington
Jake is a technology writer and product manager. He started building websites with WordPress in 2005. His writing has appeared in Popular Science, Make magazine, The New Stack, and many other technology publications.